
Most European traders struggle to extract actionable insights from their trade data manually, often missing critical patterns that could refine their strategies. This guide shows you how automated post-trade analysis tools deliver measurable improvements in consistency and execution quality. You'll learn the exact steps to implement structured trade evaluation, leverage advanced software, and achieve 10-15% performance gains within months while staying compliant with MiFID II requirements.
Table of Contents
- Introduction To Post-Trade Analysis
- Prerequisites: What You Need Before Starting Post-Trade Analysis
- Core Steps For Post-Trade Analysis
- Post-Trade Analysis Tools And Software
- Common Mistakes And Troubleshooting
- Expected Results And Improvements From Post-Trade Analysis
- Explore Novera's Automated Post-Trade Analysis Tools
- Frequently Asked Questions About Post-Trade Analysis
Key Takeaways
| Point | Details |
|---|---|
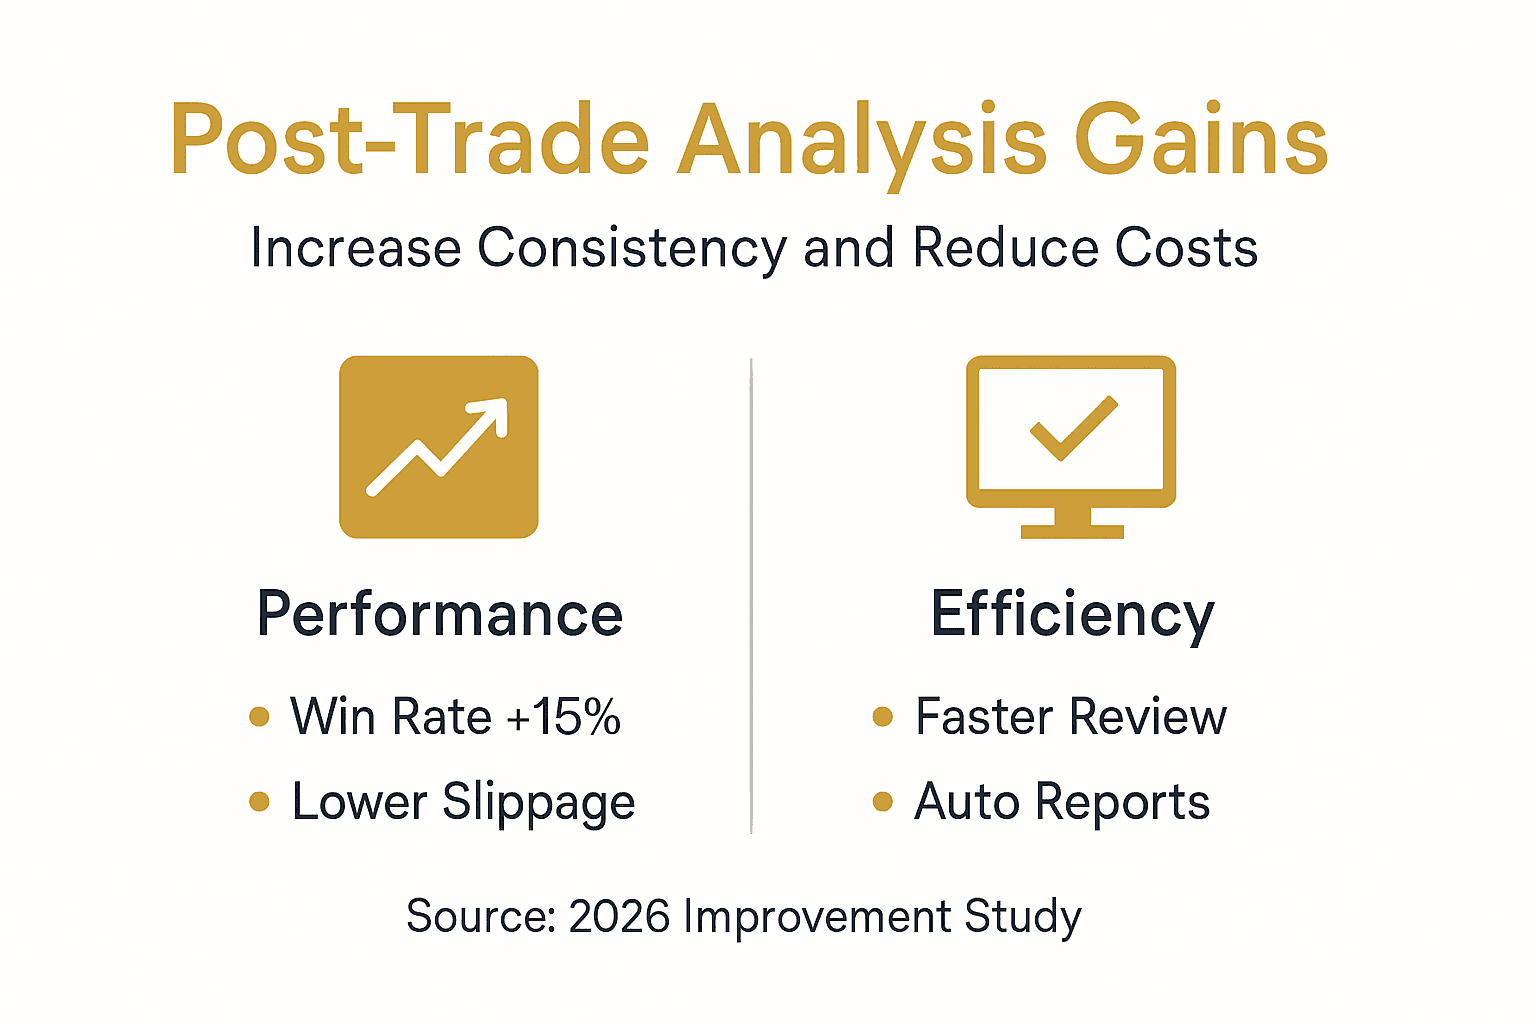
| Performance Gains | Structured post-trade analysis improves trade consistency by 10-15% within 3-6 months of disciplined practice. |
| Automation Value | Automated tools eliminate manual errors in data collection and metric calculations, saving hours per week. |
| Data Integration | Combining quantitative metrics with qualitative context reveals hidden trade inefficiencies and behavioral patterns. |
| Common Pitfalls | Manual overrides, poor data quality, and delayed reviews undermine analysis effectiveness and strategy refinement. |
| Regulatory Compliance | Regular post-trade reporting supports MiFID II compliance and audit readiness for European traders. |
Introduction to Post-Trade Analysis
Post-trade analysis is the systematic evaluation of executed trades to identify inefficiencies, measure execution quality, and refine trading strategies. For European traders, this process goes beyond simple profit and loss tracking. It involves deep examination of execution metrics, market conditions, and trader behavior to uncover opportunities for improvement.
The role of post-trade analysis using time-series analytics is transformative. Tick-level trade evaluation reveals hidden inefficiencies and improves decision-making by exposing slippage, timing errors, and execution costs that aggregate statements miss. This granular approach helps you understand not just what happened, but why it happened and how to prevent costly mistakes.
Automation brings three critical advantages to this process:
- Accuracy: Automated systems capture every data point without human error, ensuring reliable metrics for analysis.
- Speed: Software processes thousands of trades in seconds, identifying patterns that would take hours to spot manually.
- Compliance Support: Automated trade journaling solutions generate audit-ready reports that satisfy MiFID II transparency requirements.
For European traders, MiFID II compliance isn't optional. Regulations mandate detailed transaction reporting and best execution practices. Automated trading account analysis tools maintain comprehensive records and generate the documentation regulators require, reducing compliance burden while improving your trading edge.
The real power emerges when you combine quantitative data like VWAP deviation with qualitative factors such as market volatility or your emotional state during execution. This holistic view reveals why certain setups succeed while others fail, enabling targeted improvements through trading coaching and strategy refinement.
Pro Tip: Start with a 30-day baseline analysis before making strategy changes. This establishes clear performance benchmarks and helps you measure the impact of specific adjustments.
Prerequisites: What You Need Before Starting Post-Trade Analysis
Before diving into post-trade analysis, you need a solid foundation. Quality analysis depends on quality inputs and proper preparation.
Reliable trade data collection forms the cornerstone. Every trade record must include accurate timestamps, execution prices, order volumes, and fill details. Missing or incorrect data corrupts your metrics and leads to flawed conclusions. Set up automated data feeds from your broker to eliminate manual entry errors.
Access to automated journaling software compatible with your broker is essential. Manual spreadsheets can't handle the volume or complexity of serious trade analysis. Look for platforms that integrate directly with major European brokers and support multiple asset classes. Automated trade journaling software should import trades seamlessly and calculate metrics without manual intervention.
Basic understanding of key execution metrics prevents misinterpretation of results. You should know:
- VWAP: Volume Weighted Average Price measures execution quality against market average.
- Slippage: The difference between expected and actual execution price.
- Implementation Shortfall: Total cost of execution including market impact and delay costs.
Awareness of MiFID II requirements protects you from regulatory issues. The directive mandates best execution practices, transaction reporting, and record retention. Understanding these obligations helps you configure analysis tools correctly and maintain compliant documentation practices. Review the European market regulatory overview to grasp how regulations affect your specific trading style.
Ensuring your software and processes comply with European regulations requires upfront verification. Check that your tools encrypt data, maintain audit trails, and generate reports in formats regulators accept. Non-compliant systems create legal risk and may require costly migration later.
Pro Tip: Test your data pipeline weekly during the first month. Run sample analyses to catch integration issues before they corrupt months of historical data.
Core Steps for Post-Trade Analysis
Executing effective post-trade analysis follows a systematic five-step process that transforms raw trade data into actionable strategy improvements.
-
Data Aggregation and Cleaning: Import all trade data from your broker into your analysis platform. Remove duplicate entries, correct timestamp errors, and verify price accuracy. Clean data ensures metrics reflect actual execution quality rather than data errors. This step prevents the "garbage in, garbage out" problem that undermines analysis credibility.
-
Calculation of Key Metrics: Compute VWAP, slippage, implementation shortfall, and win rate for every trade. These quantitative measures reveal execution efficiency and strategy effectiveness. Post-trade analysis using time-series analytics enables tick-level evaluation that exposes micro-inefficiencies in your order routing and timing decisions.
-
Integration of Qualitative Data: Add context to numbers by logging trader emotions, market volatility, news events, and setup confidence. A profitable trade executed during high stress might indicate luck rather than skill. A losing trade during extreme volatility might reflect acceptable risk rather than poor judgment. This human layer explains the "why" behind the numbers.
-
Pattern Recognition: Analyze aggregated data to detect recurring behaviors. Do you consistently lose on Friday afternoons? Does higher confidence correlate with better outcomes? Are certain setups profitable only in specific market conditions? Pattern detection reveals hidden biases and highlights your edge. Use trade account analysis features to visualize these patterns through charts and statistical correlations.
-
Strategy Adjustment: Implement targeted changes based on discovered patterns. If analysis shows you oversize positions after consecutive wins, add a rule limiting position increases. If morning trades outperform afternoon trades, concentrate activity in profitable windows. Test adjustments for 30 days, then analyze results again. This creates a feedback loop of continuous improvement supported by automated trade review with AI.
| Metric | Purpose | Target Range |
|---|---|---|
| VWAP Deviation | Measures execution quality vs market average | Within 5 basis points |
| Slippage | Tracks price difference from entry signal | Under 2 basis points |
| Win Rate | Percentage of profitable trades | Above 50% for mean reversion |
| Implementation Shortfall | Total execution cost including delays | Below 10 basis points |
Pro Tip: Focus on one improvement area at a time. Changing multiple variables simultaneously makes it impossible to identify which adjustment drove results.
Post-Trade Analysis Tools and Software
Selecting the right automated platform dramatically impacts your analysis quality and efficiency. Modern tools offer features that would require teams of analysts to replicate manually.

Automated trading platforms like TrendSpider, Trade Ideas, and TradingView offer advanced features for backtesting, pattern recognition, and auto trade execution that enhance post-trade review accuracy. Each platform serves different trader needs and experience levels.
TrendSpider excels at technical analysis automation with multi-timeframe pattern recognition and automated trendline drawing. It integrates with major brokers and provides detailed execution reports. Best for swing traders who rely heavily on chart patterns.
Trade Ideas focuses on real-time scanning and AI-driven trade suggestions with comprehensive backtesting. The platform tracks simulated performance against live execution, revealing gaps between theory and practice. Ideal for day traders managing high trade volumes.
TradingView combines social trading features with robust charting and strategy testing. Its scripting language allows custom indicator development and automated strategy execution. The platform's strength lies in community-shared strategies and cross-asset analysis.
Key feature comparison:
| Platform | Automation Level | Broker Integration | Pattern Recognition | Compliance Tools |
|---|---|---|---|---|
| TrendSpider | High | Direct API | Advanced | Basic |
| Trade Ideas | Very High | Limited | AI-Powered | Moderate |
| TradingView | Moderate | Extensive | Community-Driven | Basic |
| Novera | High | European Focus | AI-Enhanced | MiFID II Ready |
Time-series analytics and automated journaling in these tools enable continuous monitoring without manual effort. The software runs in the background, capturing every execution detail and updating metrics in real time. This eliminates the delay between trade execution and analysis that causes memory decay and inaccurate qualitative assessments.
Your tool choice depends on trading style, experience level, and regulatory requirements. European traders should prioritize platforms with strong compliance features and European broker support. Review pricing and plans for trading tools to find options matching your budget and feature requirements.
Common Mistakes and Troubleshooting
Even experienced traders fall into predictable traps when implementing post-trade analysis. Recognizing these errors helps you avoid costly setbacks.
Neglecting psychological adaptation to automation creates resistance and undermines system effectiveness. Traders accustomed to discretionary decisions struggle to trust algorithmic analysis. This manifests as second-guessing software recommendations or cherry-picking which insights to follow. Full commitment requires viewing automation as a performance partner, not a replacement for judgment.
Manual overrides reduce algorithm effectiveness by introducing inconsistency. Every time you deviate from your automated system without documenting why, you corrupt the feedback loop. The software can't learn from exceptions it doesn't track. If you must override, log the reason and outcome to inform future rule refinements.
Poor data quality and inconsistent journaling practices poison analysis results. Skipping qualitative notes during busy periods creates gaps in context. Using multiple platforms without centralized aggregation fragments your performance history. Establish non-negotiable data hygiene standards and automate capture wherever possible.
Ignoring qualitative factors reduces analysis to sterile number-crunching. A 5% loss during a flash crash carries different meaning than a 5% loss on a quiet Tuesday. Market regime, emotional state, and external pressures provide essential context. Tools tracking only quantitative metrics miss half the story. Combine automated calculations with systematic qualitative logging for complete insight. Consider trading psychology coaching to develop emotional awareness skills.
Delaying analysis causes memory decay and inaccuracies in qualitative assessment. Trying to recall your confidence level or emotional state three weeks after a trade produces unreliable data. Review trades within 24 hours while details remain fresh. Set calendar reminders or use platforms that prompt immediate post-trade documentation.
Pro Tip: Schedule weekly 30-minute review sessions to examine patterns across your recent trades. Consistency in review timing builds the habit and ensures analysis actually drives improvements.
Expected Results and Improvements from Post-Trade Analysis
Realistic expectations help you stay committed through the learning curve that precedes measurable gains.
Consistent post-trade analysis and journaling can improve trader performance and consistency within 3 to 6 months of disciplined practice. This timeframe assumes weekly analysis sessions and monthly strategy reviews. Sporadic analysis extends the timeline and dilutes results.
Increase in win rates by 10-15% through better trade window selection represents a common outcome. Most traders discover they execute too early or too late relative to optimal entry points. Automated analysis quantifies this timing gap and helps you calibrate patience. The improvement comes from eliminating marginal setups and focusing on high-probability opportunities your data confirms.
Reduction in execution costs and slippage follows from understanding your market impact. Analysis reveals whether limit orders or market orders serve you better in different conditions. You learn which brokers provide best execution for your typical order sizes. These micro-optimizations compound over hundreds of trades.
Better adherence to trading strategies emerges from accountability mechanisms. When you know every deviation gets documented and analyzed, discipline improves naturally. The software becomes an impartial observer holding you to declared rules. This reduces emotional trading and impulsive decisions.
Key improvements you can expect:
- Faster identification of losing patterns before they cause significant drawdowns
- Increased confidence in your edge backed by statistical evidence
- More efficient capital allocation based on strategy-specific performance data
- Reduced emotional decision-making through systematic rule enforcement
Ongoing reporting value extends beyond personal improvement. Detailed records support performance reviews with coaches, provide documentation for investors or firm compliance, and create a knowledge base for training new strategies. Trade journaling tools for performance tracking maintain this history automatically, building an asset that grows more valuable over time.
Explore Novera's Automated Post-Trade Analysis Tools
After learning how post-trade analysis transforms trading performance, you need tools that implement these techniques effortlessly.
Novera offers advanced automated trade journaling that captures every execution detail without manual data entry. The platform integrates seamlessly with major European brokers, importing trades automatically and calculating key metrics in real time. You spend time analyzing results rather than wrestling with spreadsheets.
Leverage AI analytics to identify patterns invisible to manual review. The system detects correlations between market conditions, emotional states, and outcomes, then generates actionable recommendations for strategy refinement. This intelligence layer turns raw data into specific improvement steps.
Stay compliant with MiFID II and other European regulations through built-in reporting features. Novera maintains audit trails, generates required documentation, and ensures your analysis process meets regulatory standards. Compliance becomes automatic rather than an administrative burden.
Get daily automated trade analysis reports delivered to your inbox each morning. Review yesterday's performance, track progress toward monthly goals, and spot emerging patterns before they impact results. Consistent feedback accelerates improvement and maintains focus on data-driven decisions.
Frequently Asked Questions About Post-Trade Analysis
What metrics best indicate trading execution quality?
VWAP deviation and implementation shortfall provide the clearest picture of execution quality. VWAP shows whether you're getting better or worse prices than the market average, while implementation shortfall captures total costs including market impact and delays. Together, they reveal whether your order routing and timing decisions are adding or destroying value.
How frequently should I perform post-trade analysis for optimal results?
Daily review of individual trades combined with weekly pattern analysis produces optimal results. Daily review maintains fresh memory of qualitative factors while weekly aggregation reveals trends invisible in single trades. Monthly deep dives assess strategy-level performance and inform rule adjustments.
Can automated tools help with MiFID II compliance?
Yes, automated platforms generate the transaction reports, best execution documentation, and audit trails MiFID II requires. They timestamp every action, maintain immutable records, and produce standardized reports regulators accept. This eliminates manual compliance work and reduces regulatory risk.
Is it necessary to log trader emotions during analysis?
Logging emotions provides critical context that pure numbers miss. Two identical losing trades carry different lessons if one occurred during calm confidence and the other during panic. Emotional data reveals psychological patterns that sabotage execution and helps you develop better self-awareness.
How do automated platforms handle large datasets efficiently?
Modern platforms use time-series databases optimized for financial data that process millions of records in seconds. They employ indexing strategies that enable instant queries across years of trade history. Cloud infrastructure scales automatically as your dataset grows, maintaining consistent performance regardless of volume.